Monitoring and Observability for Production Crawlers
Catch crawler failures that look healthy by measuring what standard monitoring misses.

Nobody's crawler has ever thrown an alert that said "hey, this data is fake now." That sentence carries the whole problem. A crawler in production can hit 200 on every request, keep latency low, and still hand a pipeline nothing but bot-detection pages, stale HTML, or blank fields where real data used to be. This piece is about the failure mode that standard uptime dashboards can't see: a crawler that looks fine and is quietly lying to everyone downstream. Fixing that means building a second layer of instrumentation on top of whatever monitoring already exists, since the first layer was built to catch other problems.
Ask a normal application observability setup three questions: is the service up, is latency okay, are errors spiking? A crawler can answer yes, yes, and no to all three and still be dead in the water. New Relic's 2025 Observability Forecast put AI monitoring adoption at 54%, so most teams already run some kind of telemetry pipeline. Almost none of it is wired to the signals that actually predict a crawler falling over. That gap is the subject here.
The four failure classes that make crawlers uniquely hard to observe
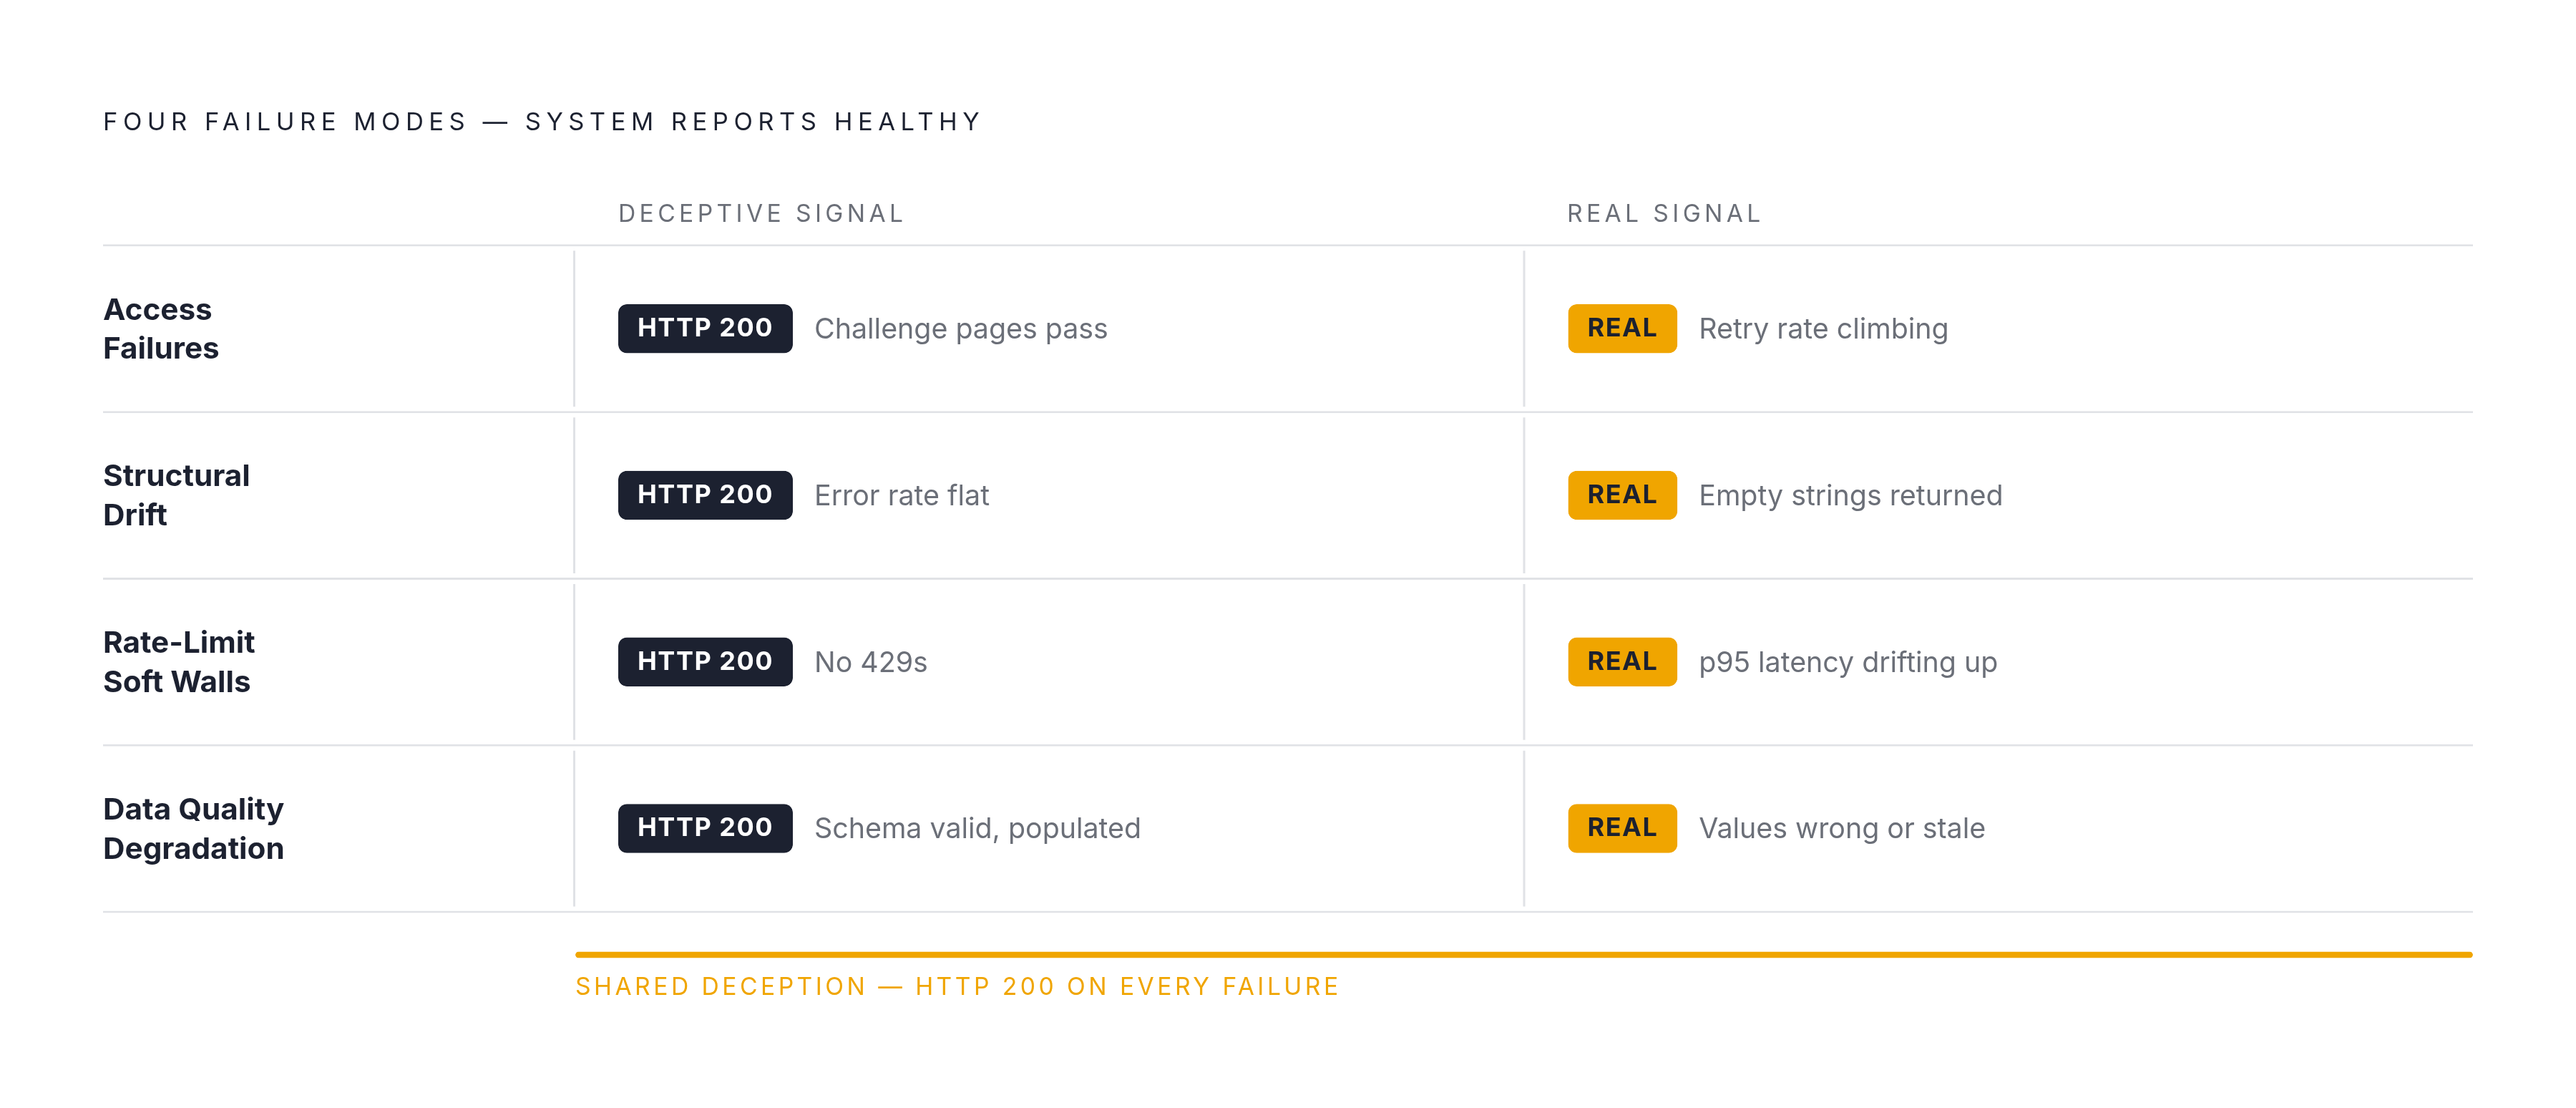
Four things go wrong with crawlers that don't go wrong with a normal web service, and all four share the same nasty trait: the system reports healthy while it's actively failing.
Access failures come first, and they're sneaky about it. A site starts serving a verification or challenge page, but the HTTP layer still returns a 200. Nothing looks broken from the outside. Underneath, retries pile up on that domain long before anything resembles a hard error. A practitioner post on DEV Community lays out the pattern well: tracking spans where scraper.retries > 0 gives an early warning before a domain goes into a full ban. By the time actual errors show up, the window to respond cleanly has often already closed.
Structural drift, the second class, is also the most common one by a wide margin. A site ships a redesign, moves a div, renames a class, and the parser keeps running without complaint. It just returns empty strings where real values used to be. No exception, no crash, just quiet emptiness. Parser failure rate and null-field rate are the signals that catch this, not HTTP error rate, which stays flat the entire time. Swapping in LLM-based extraction doesn't fix this, it just moves the failure somewhere new: instead of watching selectors fail, teams have to watch confidence scores and field-level nulls instead.
Rate-limit soft walls are the third class. Long before a site starts returning 429s, it starts throttling quietly. Response times creep up, p95 latency drifts, and none of it looks like an outage on an aggregate dashboard. Per-domain latency and queue trends catch this. Aggregate latency just averages the pain away and buries it.
Data quality degradation rounds out the list as the sneakiest of the four. Output can be structurally perfect, every field populated, schema validated, and still be wrong or stale. Freshness delay (the gap between when a page changed and when the crawler caught it) is the signal that exposes this. The downstream symptom shows up somewhere else entirely: a model reasoning over garbage data while the crawler's own logs show a clean run.
None of these are edge cases. They're the default operating condition of running a crawler against the live web at any real scale.
The signal layer: what a production crawler must actually measure
Four groups of signals matter here. Three of them, requests per second by domain, p95 response time by domain, and queue size trend, form the real-time foundation everything else sits on.
Access-layer signals start with per-domain request rate, not an aggregate number. Aggregates hide selective blocking; per-domain numbers expose it immediately. Retry rate per domain is the earliest warning of a soft block, and proxy pool exhaustion rate shows whether those retries are burning through quota fast. Response body fingerprinting catches the ugly case where a challenge page comes back wrapped in a perfectly polite 200.
Latency signals need the same per-domain treatment, no exceptions. A 95th-percentile response time measured across the whole crawl fleet hides the three domains actively throttling requests. Queue size trending upward while throughput stays flat is the tell-tale sign of a soft rate-limit wall forming. When time-to-first-byte and full page load time start diverging, that usually points to client-side rendering overhead creeping in.
Extraction quality signals live at the field level, not the record level, and that distinction is the whole point. Parser failure rate per domain and per schema field finds drift faster than any aggregate count ever will. Null and empty field rates per attribute are the primary early warning for structural drift. Schema version mismatch events, logged whenever output fails validation against the expected shape, catch the cases where a script change on the source site silently reshapes the output.
Freshness signals close the loop. Crawl-to-index latency measures the gap between a URL entering the queue and structured data landing where it needs to land. Content age at extraction (the page's own timestamp versus the crawl timestamp) catches caching artifacts. Recrawl delta rate, the share of recrawled URLs that actually changed, tells a team whether it's burning crawl budget on pages that never move.
Pipeline health signals sit on top of all this: end-to-end freshness delay from the downstream view, and deduplication collision rate, which climbs when URL normalization starts failing upstream.
How to instrument a crawler with structured traces and logs
OpenTelemetry is the default choice here, and it's not really up for debate anymore. Industry research has found 79% of organizations using observability tools are using or considering OpenTelemetry. It's become the shared language for structured telemetry across the industry, crawlers included, and picking something else at this point mostly just means writing custom glue code nobody else can read.
Cost isn't a real objection either. OpenTelemetry adds under a millisecond of overhead per call. Network I/O in a crawler runs orders of magnitude slower than that, so the instrumentation is close to free on any realistic latency budget. The OpenTelemetry Collector runs as an agent or a gateway, handling ingestion, processing, and export across 200-plus components, which covers high-volume crawl pipelines without much strain.
Span design should map to the actual crawl pipeline, not to some generic template. One root span per job or batch. Underneath it, a child span per URL covering fetch, render (if client-side scripting is involved), extract, validate, and emit. Every span should carry domain, URL hash, HTTP status, retry count, extractor version, schema version, and content hash as attributes. Attach errors directly to the span rather than logging them off to the side, so the whole trace stays self-contained when someone's debugging at 2 a.m.
The retry storm pattern from that DEV Community post is cheap to build and catches real problems: build a derived metric counting spans where retry count is greater than zero, grouped by domain. A domain climbing from its normal 1% retry baseline to 8% in ten minutes is a very different animal from one that always sits at 5%. Alert on the rate of change, not the raw number, or the alert fires constantly on domains that are just naturally chattier than the rest.
Logging discipline, the part teams skip first when they're in a hurry, matters just as much as tracing. Every log line needs job ID, domain, URL, extractor version, per-field extraction results, and trace context so it can tie back to the span that produced it. Log at the field level. "Record written" hides the exact null-field drift that shows up right before a structural failure gets loud. Schema validation failures should get logged as structured entries with a diff payload attached, so downstream tooling catches drift automatically instead of someone noticing it by accident three days later.
Trace context should also travel past the crawler itself, all the way through the data store and into whatever AI pipeline consumes the output. When a model produces a bad answer, the trace needs to show which crawl produced the input, which extractor version touched it, and how stale it was at inference time. W3C Trace Context propagation gives a compatible way to carry that context when a crawler feeds an agent-based pipeline.
Alerting strategy: where to draw the lines and why thresholds alone fail
Static thresholds fail on crawlers constantly, in both directions. Error rates swing by time of day, by whatever deployment schedule the target site runs on, by the crawler's own batching rhythm. Set "alert if error rate exceeds 5%" and it misfires on ordinary Tuesday variance while missing the structural drift that never touches the error rate at all.
Better alerting looks for rate of change, not fixed lines. Retry rate per domain, watched for a sudden jump rather than an absolute number, catches blocking before it turns into a ban. Null-field rate per schema attribute, watched as a trend, catches drift before bad data spreads through the pipeline. Freshness SLOs, phrased as something like "no valid new record for domain X in some set number of minutes," catch silent stalls that never generate a single error. Queue growth alerts, tripped when depth keeps rising without a matching rise in throughput, catch soft throttling and dead-letter pileup before either one becomes an incident.
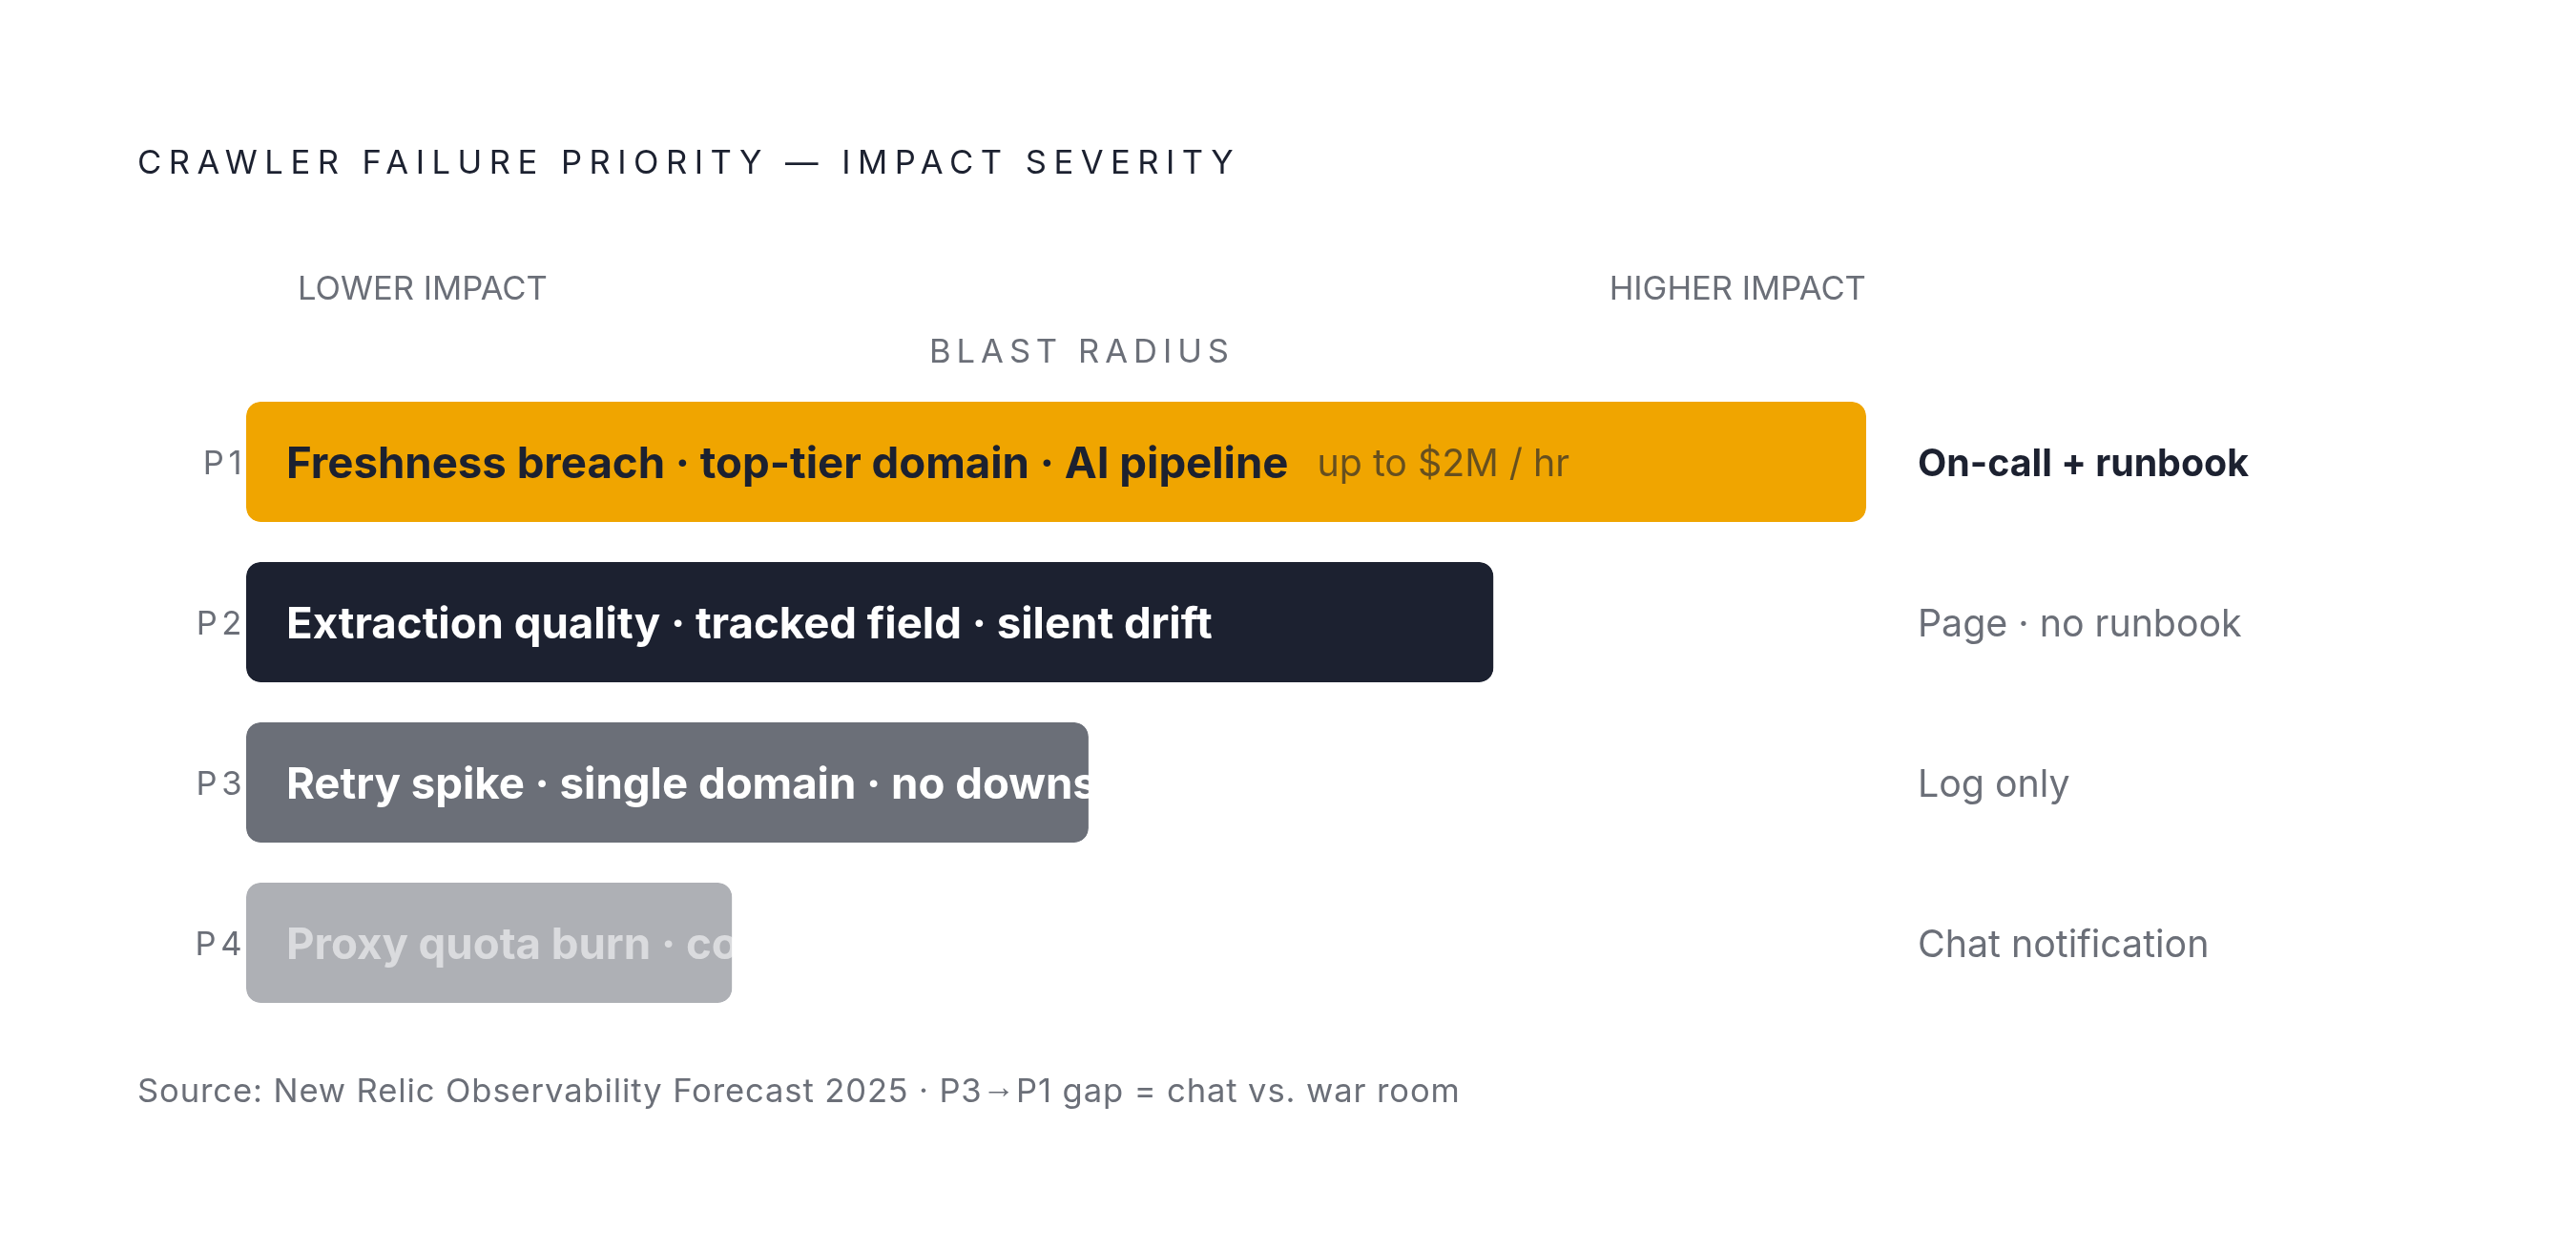
Tiering keeps the noise down, and it should be strict about it. A freshness breach on a top-tier domain, one that feeds a downstream AI pipeline directly, is a P1. Extraction quality degradation on a tracked field is P2, since it can propagate quietly for hours before it becomes a P1. A retry spike on a single domain with no downstream impact yet is P3, worth logging but not worth waking anyone up over. Proxy quota burning faster than forecast is P4, a cost signal rather than a failure.
New Relic's 2025 Observability Forecast puts the cost of high-impact outages at up to two million dollars an hour in some cases. Catching a crawl failure at P3 instead of P1 isn't a nice-to-have, it's the difference between a routine chat notification and a war room. Stale or missing data landing in a production AI pipeline carries a real cost, and that cost compounds the longer it goes unnoticed.
Routing matters too. P1 and P2 alerts should land on-call with a runbook link attached, not just a dashboard URL someone has to go interpret cold. Runbooks should spell out which domains are affected, which downstream systems consume them, and a clear decision tree: quarantine, retry, or escalate.
Monitoring crawl quality when AI-powered extraction is in the pipeline
LLM-based extraction changes what failure looks like, and not in a convenient way. A classical selector fails loud: null, exception, empty string, something a monitor can grab onto. An LLM extractor fails quiet. It hands back something plausible-sounding that's wrong, made up, or lifted from the wrong part of the page. Schema validation still catches structural breaks, but it has nothing to say about whether the content is actually true, a gap most teams miss when they swap a parser for a model and assume monitoring stays the same.
A few signals matter specifically here. Confidence scores per field, where the model exposes them, should trigger a quarantine, not just get logged and forgotten. Extraction consistency, running the same URL through the same prompt twice and measuring how much the answers diverge, gives a read on how stable the extraction really is. Model version and prompt version need to ride along on every span, because a prompt tweak that shifts the output distribution looks identical to a site layout change unless that metadata sits right there to tell them apart. Token usage per extraction is worth watching too: a sudden spike on a given domain class usually means the page structure changed and the model is working harder to make sense of it, often before accuracy actually drops.
The practical pattern is to route anything with low confidence or high token variance to a human review queue instead of letting it flow straight into the pipeline. Those flagged extractions then become labeled examples for prompt regression testing, the same trace-to-dataset loop that general AI observability platforms like Langfuse, Braintrust, and Confident AI support, just applied specifically to the extraction step.
The nastiest version of this risk is compound: an LLM extractor can degrade silently on a new page layout and keep producing confident, wrong output for hours before the null-field rate climbs high enough to trip an alert. Confidence tracking paired with freshness SLOs is the only real defense against that gap, and skipping either one leaves a blind spot the other can't cover alone.
The tooling landscape for crawler observability in 2026
Two layers exist here, and conflating them is where most teams get confused. Layer one is the crawl infrastructure itself, the thing being instrumented. Layer two is the observability backend, where that telemetry gets sent, queried, and alerted on. Everything described above lives in layer one. What follows is layer two, and picking the wrong one won't fix a bad layer-one setup.
Prometheus and Grafana remain the open-source default, and for good reason. Grafana's 2025 survey found Prometheus running in production at 67% of organizations, and it fits crawler metrics well: per-domain counters, latency histograms, queue gauges, all without a license fee for the core stack.
Datadog offers a more turnkey path instead. It auto-instruments common HTTP libraries and captures latency and error rates with no code changes, though custom metrics still need extra setup on top. Its built-in anomaly detection works well on metric streams, and it fits teams already running Datadog for application observability who want to stretch it to cover crawl infrastructure too. Datadog added native support for OTel GenAI conventions starting with version 1.37, announced in December 2025, which matters directly for teams running LLM extraction inside their crawl pipeline.
New Relic launched Agentic AI Monitoring in November 2025, aimed at the same visibility gap this piece has been circling the whole way through: the space between a crawler emitting clean-looking output and a model quietly reasoning over data that was already wrong before it ever entered the pipeline. Pick the tool that matches where the pain actually shows up, not the one with the shiniest dashboard demo.