Monitoring and Maintaining Production Scrapers
Keep scrapers running by catching silent failures before they corrupt your data.

Production scrapers don't retire gracefully. They don't send a farewell email. They just quietly start returning garbage. Or nothing. And the worst part? Your monitoring dashboard stays green the whole time.
That's the real problem with running scrapers in production. A scraper isn't a finished piece of software you ship and forget. It's a live contract with a third-party website — like a handshake agreement where the other party can change the terms at any moment without notice. And that website updates its side of the contract whenever it wants, without telling you. The DOM shifts. The anti-bot vendor pushes a new detection model. A proxy IP gets flagged. Your data starts decaying, and you find out three days later when someone downstream asks why the prices look wrong.
Community data from r/webscraping puts the breakage rate at somewhere between 10 and 15 percent of production scrapers per week due to site changes alone. Scale that across a fleet of even a dozen targets and you're looking at a full-time maintenance problem. This piece is about building the operational system that keeps that from becoming a crisis: what to watch, how to catch failures before they go silent, and how to get back up fast when something breaks.
The External Forces Actively Working Against Your Scraper's Stability
Let's be honest about what's happening on the other side of the wire.
Bots now account for 53% of all web traffic, according to the 2026 Thales/Imperva Bad Bot Report. Bad bots specifically claimed 40% of that traffic, up from 37% the year prior. AI-driven bot traffic grew 187% in a single year while human traffic grew just 3.1%, per HUMAN Security. Websites are not being paranoid. They are responding to a measurable, accelerating invasion. And their defenses have gotten sophisticated.
The days of IP-based blocking as the primary defense are over. Here's what detection looks like now:
- TLS fingerprinting. Your HTTP client library has a fingerprint at the handshake level, before your first request even lands. Detection happens before you send a single byte of content.
- Browser fingerprinting. Canvas rendering, WebGL output, installed fonts, screen resolution, hardware concurrency. Hundreds of signals, cross-referenced simultaneously.
- Behavioral analysis. Perfect, robotic consistency is itself a red flag. Real humans are erratic. They pause. They scroll unevenly. They take weird detours.
- Honeypot traps. Elements invisible to human users that silently fire an alert the moment a bot touches them.
The WAF (web application firewall) market hit $11 billion in 2025. Enterprise-grade protection is now standard infrastructure, not a bespoke build.
Here's the nuance though: not every site is hardened. A substantial majority of websites tested recently had no meaningful bot protection at all, while only a small fraction had comprehensive, multi-layered defenses. The threat is real, but it's uneven. Your monitoring strategy needs to reflect which tier your targets sit in. A quiet e-commerce blog with no WAF fails in a completely different way than a major retail platform running behavioral analysis. Build your monitoring to distinguish between them.
What a Production Scraper Actually Consists Of — And Where Each Layer Can Fail
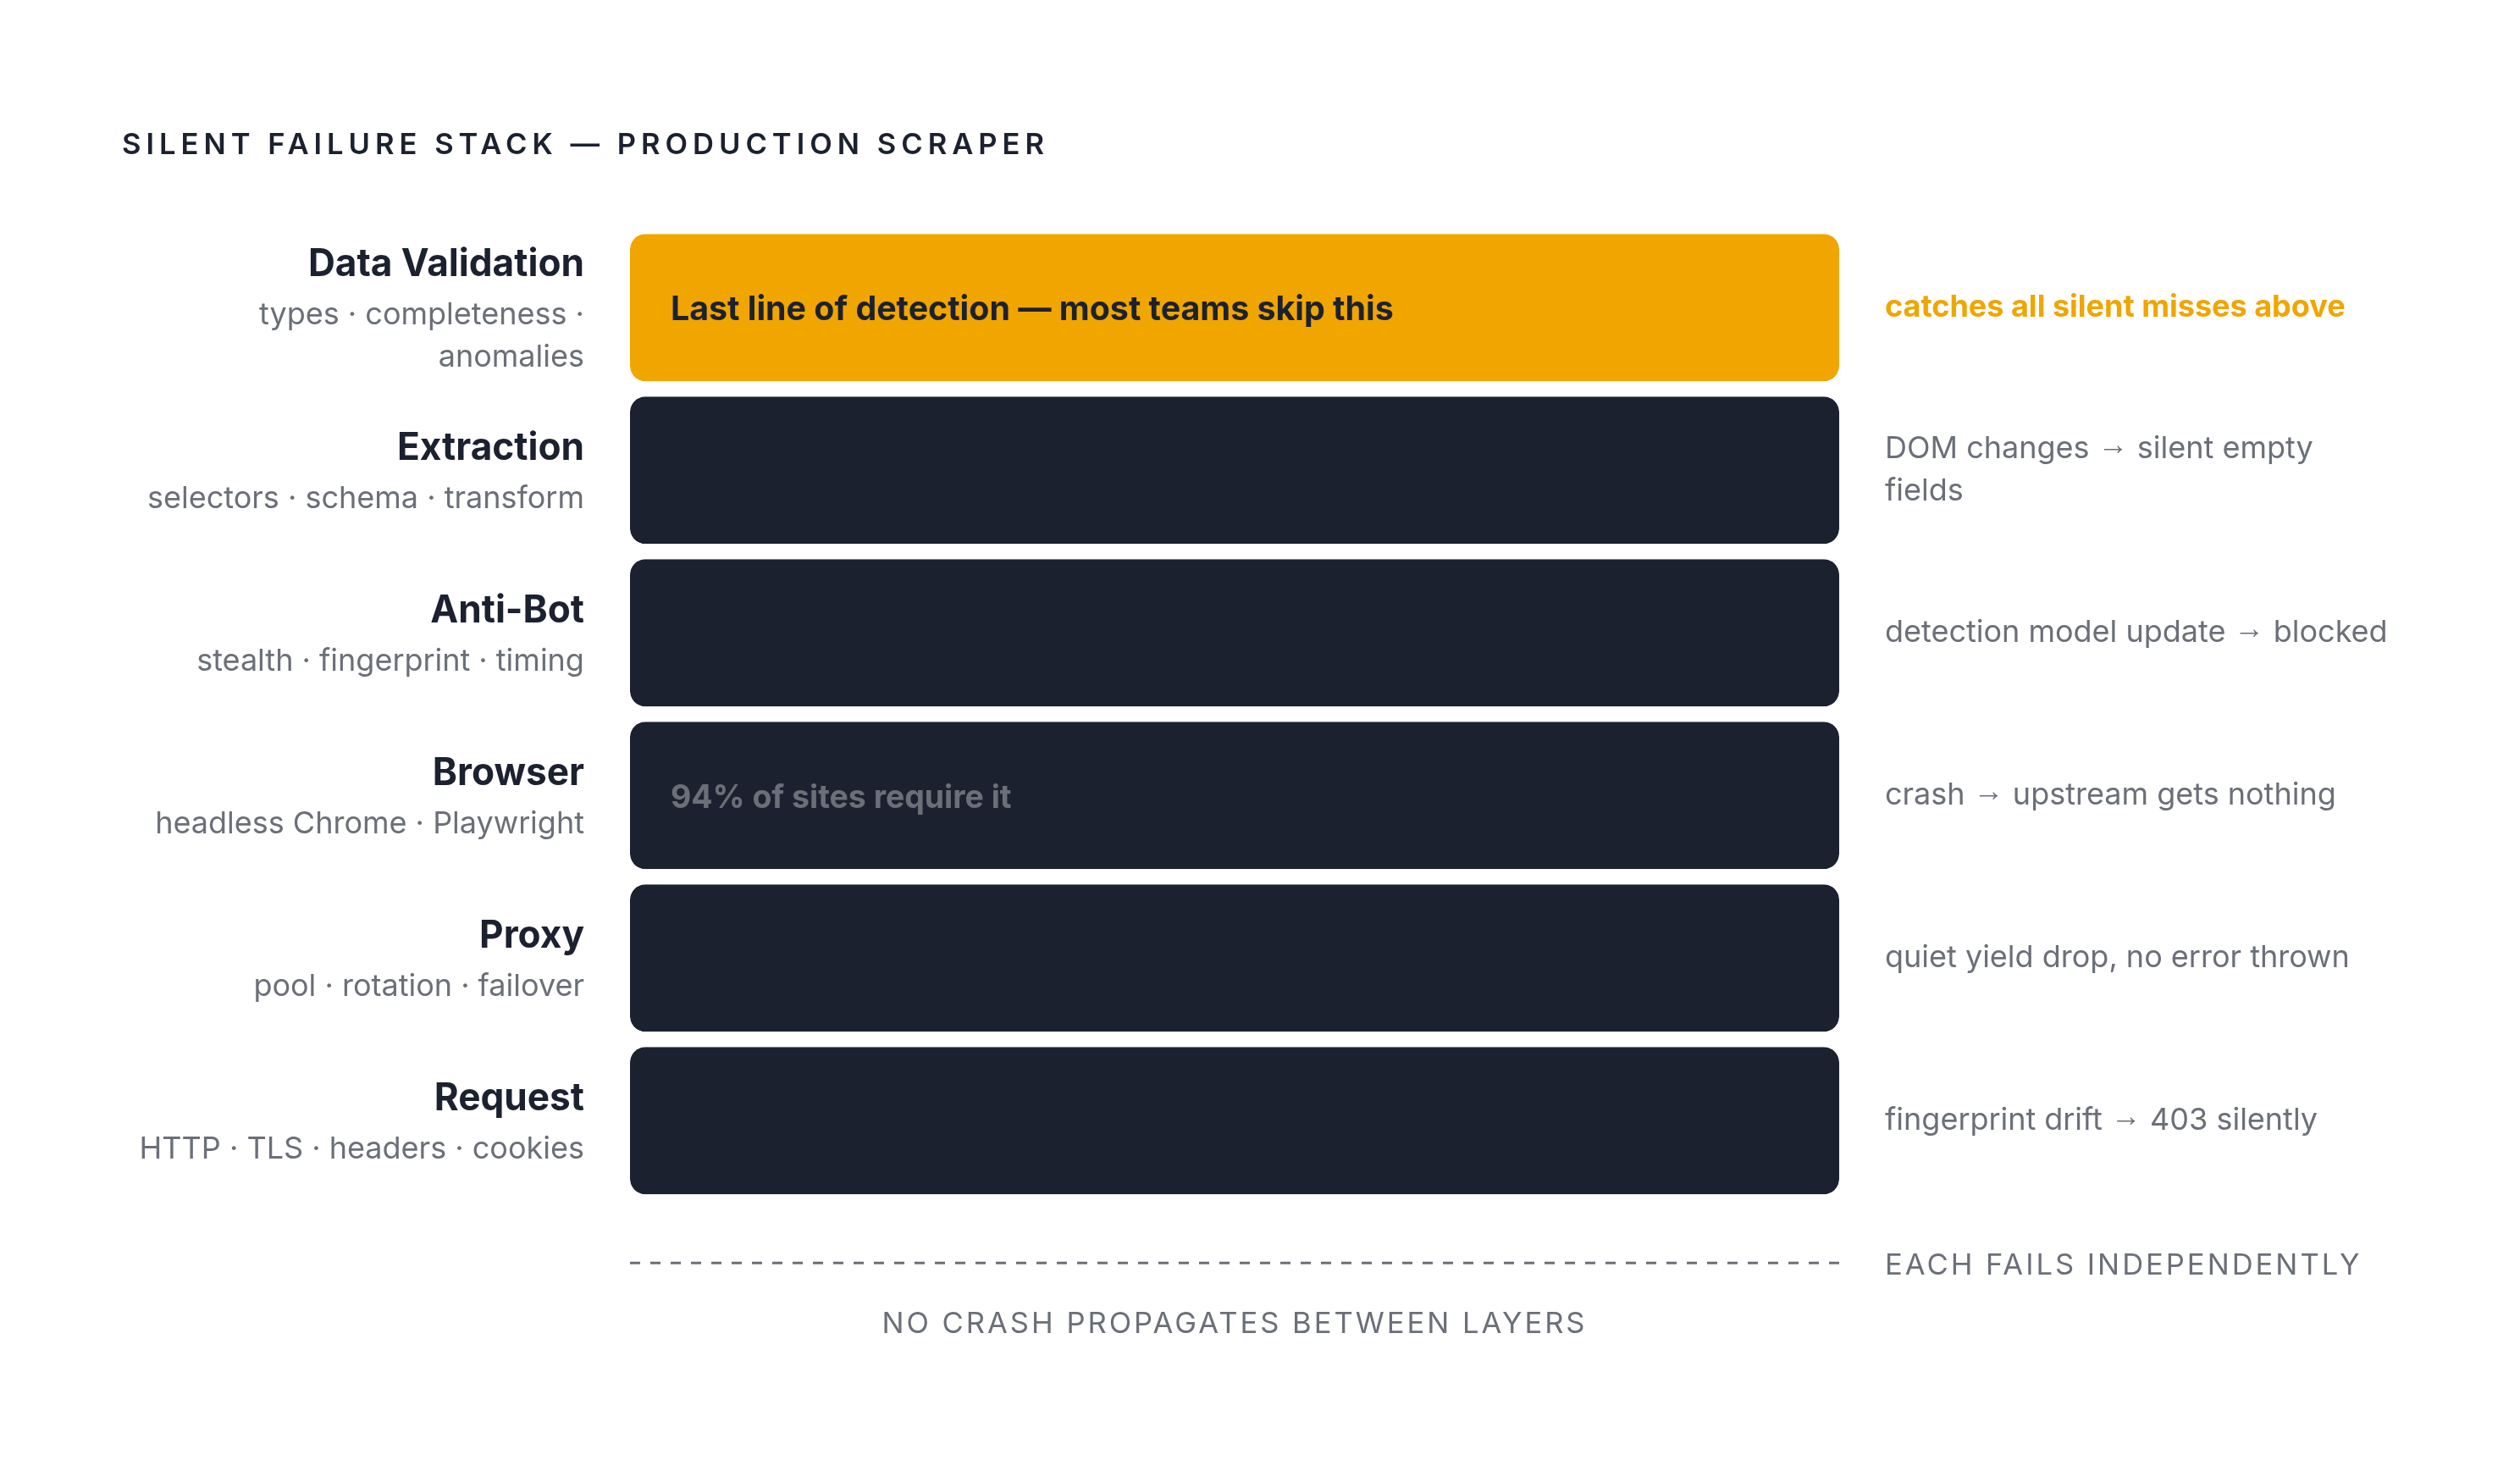
People say "the scraper broke." That's not a useful diagnosis. A production scraper isn't a script. It's a layered system, and each layer fails independently.
Here's what that stack actually looks like:
- Request layer. Your HTTP client, TLS config, header management, cookie handling. Fails quietly when fingerprints drift or cookies expire.
- Proxy layer. Pool management, rotation logic, health checks, failover logic. A degraded proxy pool crashes nothing. It just quietly reduces your yield.
- Browser layer. Headless Chrome or Playwright instances, memory management, crash recovery, session isolation. (And for context: around 94% of modern sites require browser automation to render content fully.)
- Anti-bot layer. Stealth patches, fingerprint spoofing, behavioral timing. Fails when detection models update and your mimicry is no longer convincing.
- Extraction layer. Selectors, schema definitions, transformation logic. Fails when the DOM changes without warning, which it will.
- Data validation layer. Type checks, completeness checks, anomaly detection. This is often the layer that catches what everything above missed.
The dangerous failure pattern here is that layers fail silently and independently. A broken proxy pool doesn't crash the browser. It just means fewer requests succeed, and you won't notice until your record count drops and someone downstream asks a question.
Scale makes this worse. A bad selector that only fires on a rare page layout? At low volume, it passes. At production scale, it corrupts your dataset. Timing issues that look fine on a single instance explode into rate-limit triggers when you parallelize.
The architectural implication is practical: separate proxy management from scraping logic. That separation means you can monitor and scale each one independently. When the proxy pool degrades, you don't have to touch the scraper. When the scraper's selectors break, your proxy health dashboard stays clean and tells you the proxies aren't the problem.
The Metrics That Tell You a Scraper Is Degrading Before It Fully Breaks
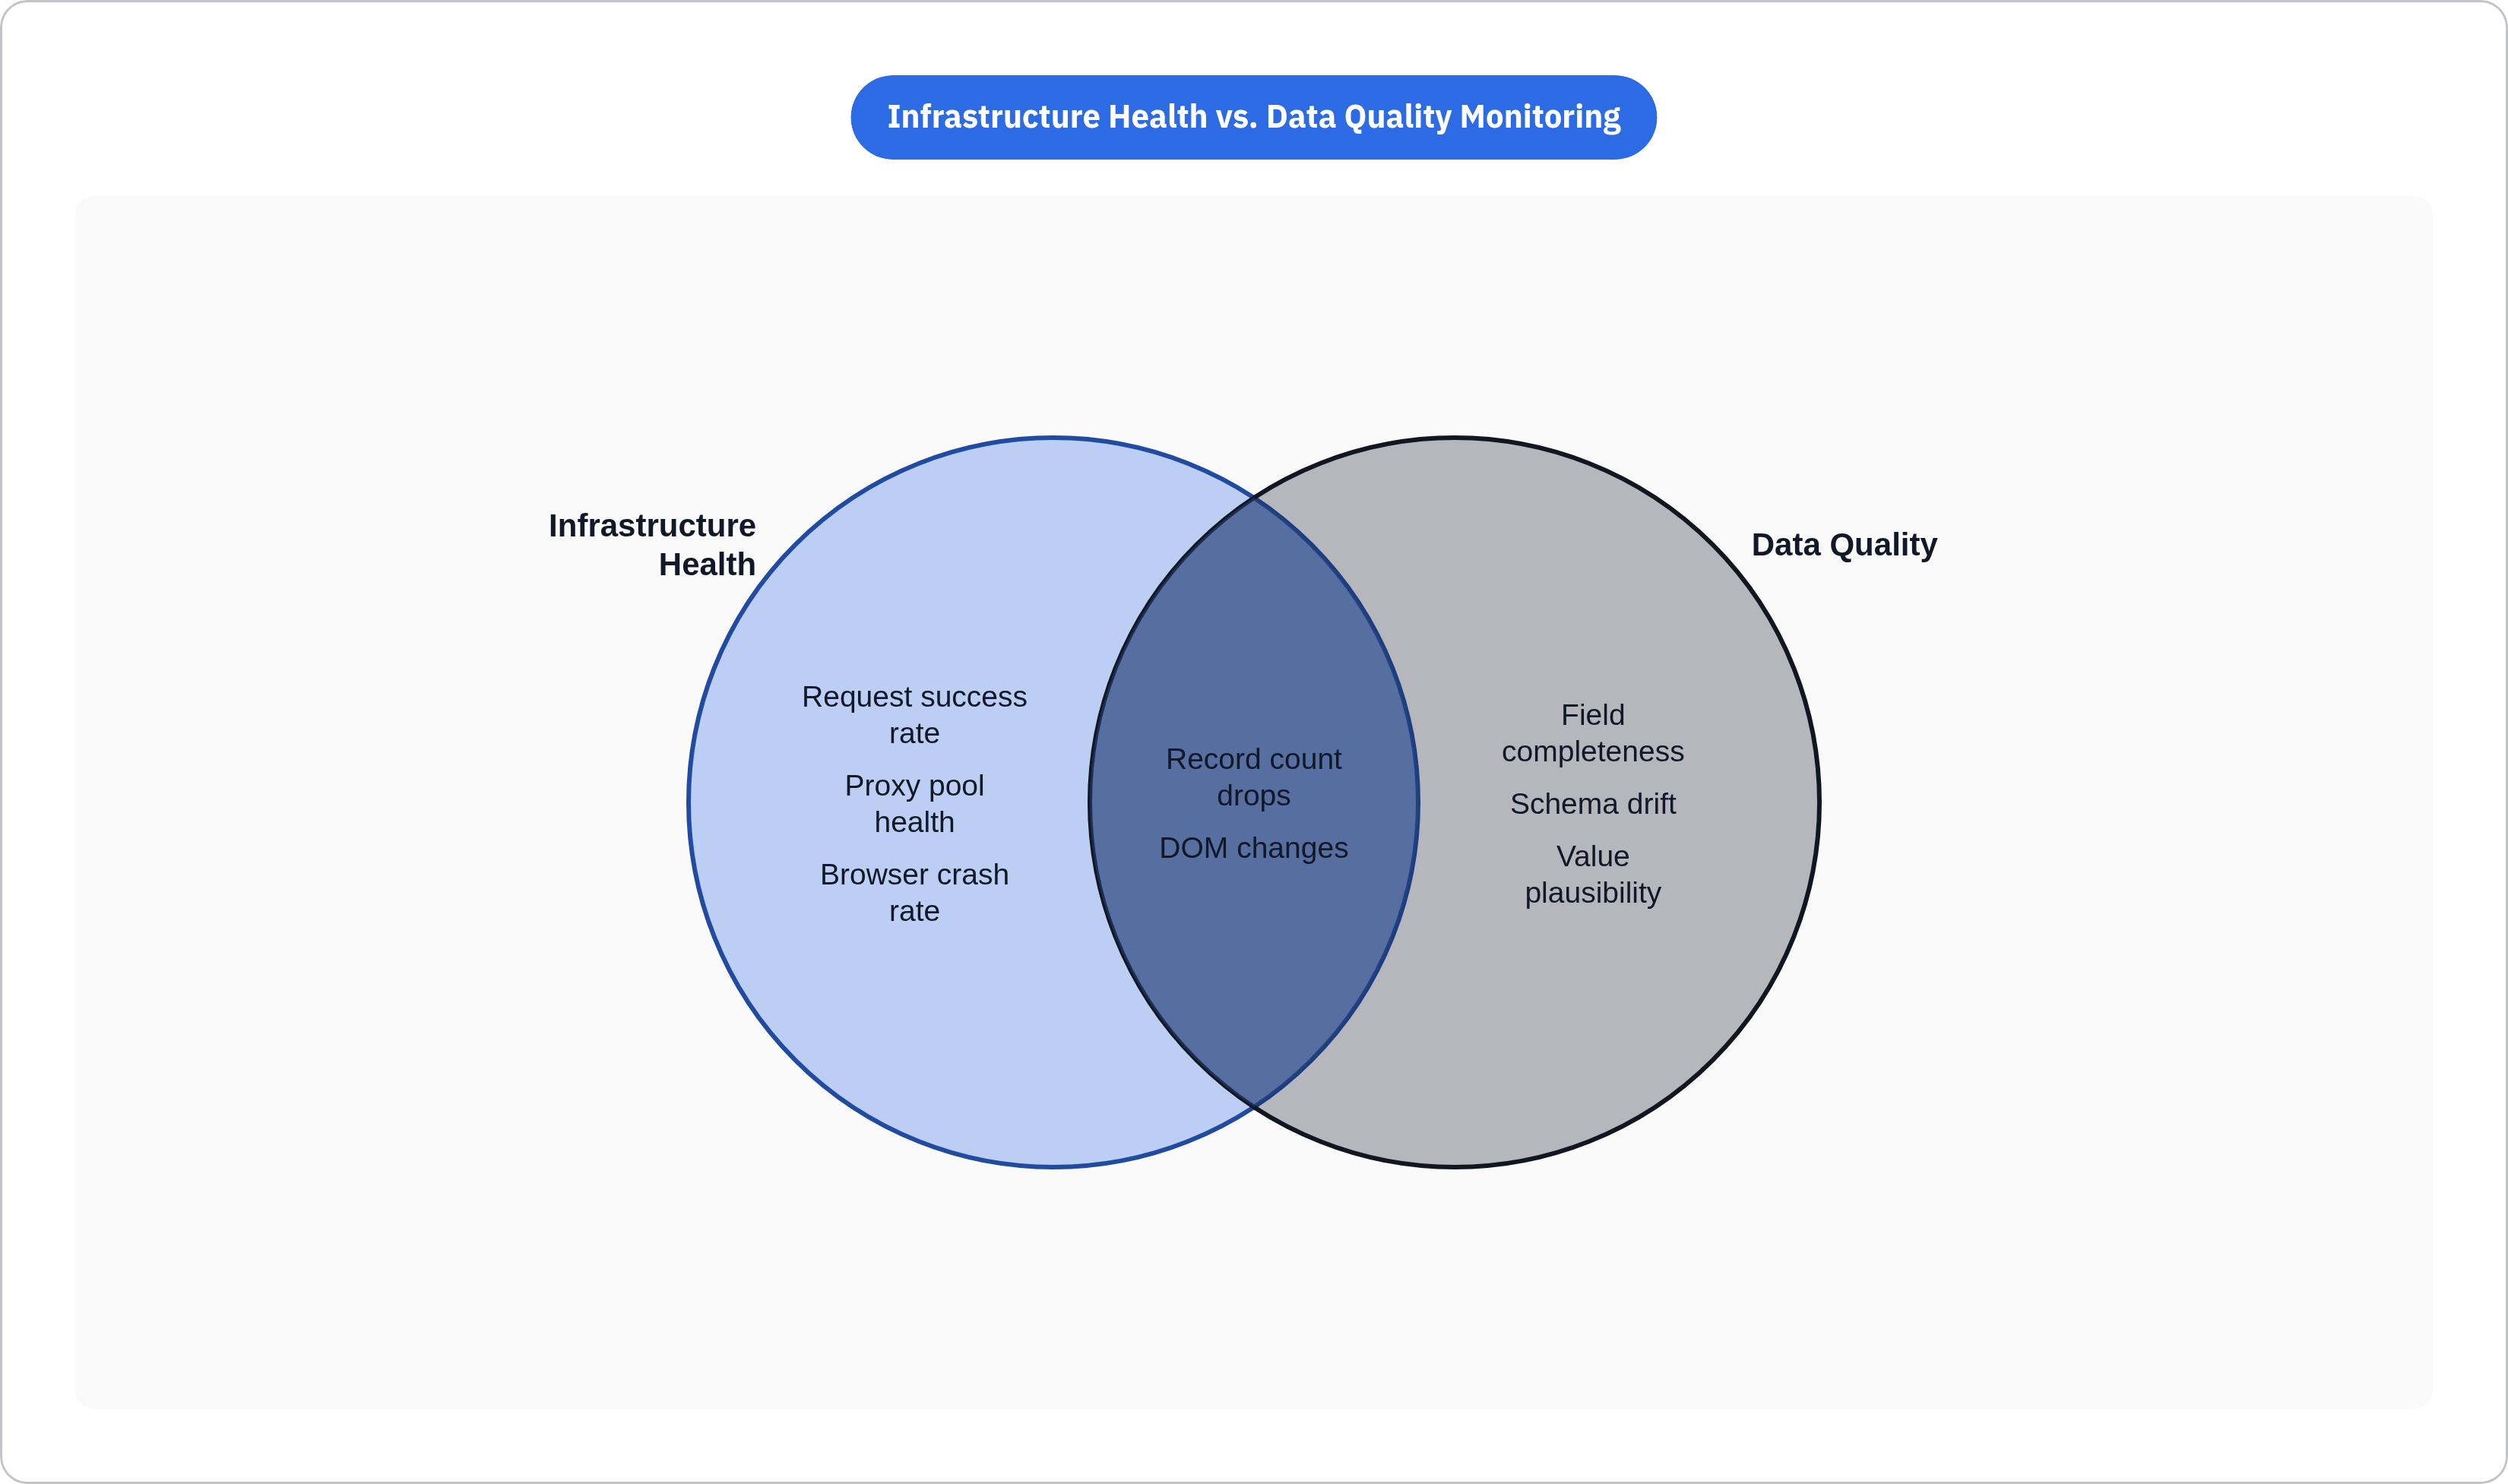
You need two monitoring planes. Infrastructure and data quality. They can fail independently, and you need both.
Tier 1: Infrastructure Health
These tell you whether the system is running:
- Request success rate. If it drops below 85%, something is wrong. That's your alert threshold.
- Response time. A 10% slowdown from baseline is worth investigating. Throttling often precedes an outright block.
- Proxy pool health. Churn rate, ban rate per pool, how frequently you're failing over. Proxies don't announce their retirement.
- Queue lag. A growing backlog means throughput dropped without throwing an obvious error.
- Browser crash rate and memory pressure. Headless instances are resource-hungry. Unmanaged, they degrade.
Tier 2: Extraction Quality
These tell you whether the data is any good:
- Field completeness. Track null rates per field. A field that was 99% populated suddenly dropping to 60% is not an infrastructure problem. That's a selector problem.
- Schema drift. Flag when extracted fields change type or format unexpectedly.
- Record count deltas. A sudden drop in records per run usually means silent blocking or a structural DOM change.
- Value plausibility. Price fields returning zero. Name fields returning HTML fragments. Dates in the wrong century. These aren't exotic edge cases; they happen.
Tier 3: Adversarial Signals
These tell you the site is actively pushing back:
- CAPTCHA encounter rate. Rising CAPTCHA frequency is an early warning that your fingerprint is degrading.
- Redirect pattern changes. Unexpected redirect chains often precede soft blocks.
- Response body anomalies. A 200 status code that contains a "verify you're human" page is not a success. Your monitoring needs to read the body, not just the status code.
The failure mode worth underlining: your infrastructure metrics can look completely healthy while your data is silently rotting. Both tiers are required. Monitoring only one gives you a false sense of stability.
Building an Alerting Layer That Catches Real Failures Without Generating Noise
Alert fatigue is an operational risk just like downtime is. An over-alerted team starts ignoring pages. And then something actually breaks and nobody moves.
The goal is a signal that reliably means one thing: a human needs to look at this.
Threshold Design
- Use rolling windows, not point-in-time checks. One failed request is noise. A 15-minute success rate below 85% is a signal worth acting on.
- Differentiate transient from structural failures. A success rate that recovers in one retry cycle is a proxy blip. One that persists across three retry cycles is something real.
- Tier your alerts by severity. Proxy pool degradation? Page on-call. A field null rate ticking upward? That's a ticket for a daytime engineer, not a 3am wake-up.
Error Categorization
Before you route an alert, categorize the error. Network errors, anti-bot blocks, and structural extraction failures are three completely different problems. They have different owners and different response playbooks. Logging raw error strings isn't enough. Normalize them into types so your alerting logic can route them correctly.
Regression Testing as a Scheduled Alert
Run each scraper against a frozen, known-good snapshot of the target on a schedule. Compare the new output against the prior run. Unexpected disappearances, price anomalies, or structural mismatches should trigger investigation automatically. This catches the category of failure that no infrastructure metric will catch: silent data corruption.
Tooling Notes
Datadog and Grafana are the two standard options for infrastructure-level alerting. The practical choice comes down to managed convenience versus open composability. Datadog gets you up fast; Grafana gives you more control at lower cost if you're willing to run it yourself.
If you're running AI-powered scraping pipelines, infrastructure observability tells you whether the system is healthy. Output quality from an LLM extraction step requires a separate layer. Tools like Langfuse or Arize handle that evaluation. In practice, you need both.
Diagnosing a Broken Scraper Quickly: A Triage Sequence That Reduces Mean Time to Recovery
Here's the cost reality: maintaining a simple scraping target realistically runs four to eight hours per month at minimum. Heavily protected sites can cost 20 or more hours per month. Unstructured debugging multiplies those hours in a hurry. Having a triage sequence you follow every time is how you protect that time.
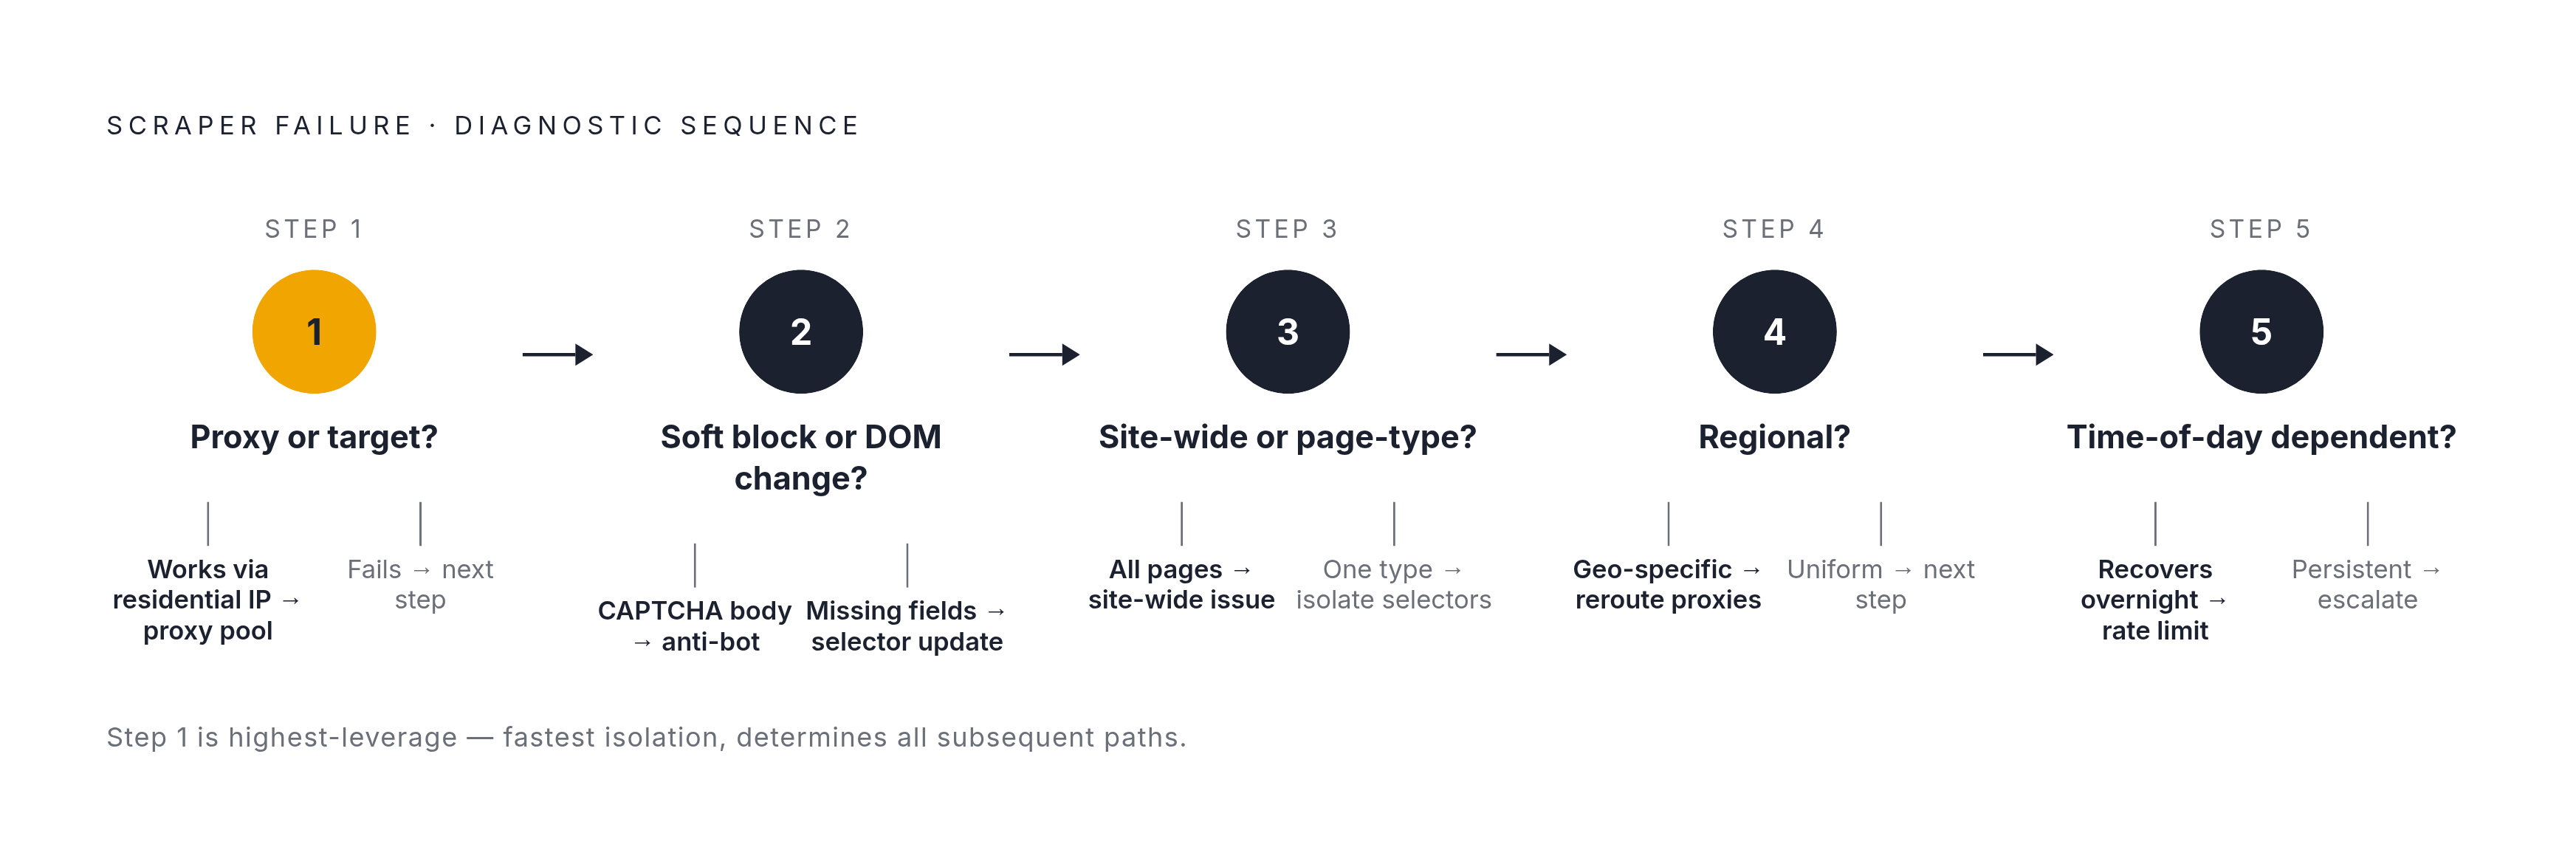
Step 1: Is it the proxy or the target? Run the same request manually through a clean residential IP. If it works, the proxy pool is the problem, not the site. Start there.
Step 2: Is it a soft block or a structural change? A 200 response with unexpected body content (CAPTCHA page, empty container, login wall) means anti-bot detection. A 200 with correct structure but missing fields means a DOM change. These have completely different fixes.
Step 3: Is the change site-wide or page-type specific? Product detail pages failing while category pages succeed isolates the scope before you start touching selectors everywhere.
Step 4: Is it regional? Test from proxy geolocations in different geographies. Some anti-bot rules are geography-specific. A block that's hitting your EU proxies may not be hitting US-based ones.
Step 5: Is it time-of-day dependent? Some rate limiting and behavioral analysis is velocity-sensitive or session-duration-sensitive. A scraper that fails during peak hours and recovers overnight is telling you something about velocity limits.
Selector Inspection Protocol
When you've established it's a DOM change:
- Diff the current live HTML against your last known-good snapshot.
- Identify whether the target element moved, was renamed, or was replaced with a dynamically rendered equivalent.
- Check whether JavaScript rendering replaced what previously matched as static HTML.
Logging Practices That Make Triage Faster
Store raw response bodies (or a sample of them) at the point of failure. Error codes alone are not enough. Tag every request with proxy type, geolocation, and session age. When you're doing post-hoc analysis, those dimensions are often exactly what you need to find the pattern.
Selector and Schema Maintenance as an Ongoing Engineering Discipline
Selector rot is quiet. A site redesign happens, a developer renames a CSS class, a product team restructures the page layout. Nobody emails you. Your scraper just starts returning empty strings or, worse, the wrong data.
Writing Selectors for Durability
The practical principle: target meaning, not position.
- Prefer semantic attributes.
aria-label,data-testid,itempropchange far less frequently than structural CSS paths. - Avoid
nth-childselectors and deeply nested paths that encode the entire page layout. Any layout update breaks them. - Where semantic attributes are absent, define multiple selector candidates in priority order. If the first one fails, try the second. Log when you fall back.
Schema Versioning
Treat your extraction schema like an API contract. Version it. Document it. Test against it on every run. When a schema breaks, the diff between expected and actual structure is your fastest path to a fix. Teams that treat schemas as informal, undocumented configurations spend hours in debugging sessions that could have taken 20 minutes.
The Case for AI-Assisted Extraction
LLM-based extraction targets semantic meaning rather than structural position. Telling an AI to "extract the price of the product" is more resilient than a CSS selector pointing to a specific div that may or may not still exist tomorrow.
The tradeoff is real: higher cost and latency per page. This approach makes sense for high-value targets where breakage is expensive. The emerging pattern that's working well in practice: use AI extraction as a fallback when primary selectors fail, so you pay the premium only when something has already gone wrong. Cost stays low at steady state; resilience holds when the site changes.
The Maintenance Cost Reality
At standard developer rates, four to eight hours a month of selector and schema maintenance per target adds up fast across a fleet. That's the number that justifies investing in durable selector design upfront rather than patching constantly.
Keeping Proxy Infrastructure Healthy Under Sustained Production Load
Proxy health is not a configuration. It's a continuous maintenance task. Proxy pools degrade on their own timeline, and they don't ask permission.
What to Track
- Ban rate per IP and per pool. The ratio of blocked responses to total requests. Watch it trend over time, not just point-in-time.
- Proxy latency distribution. Outliers in latency often indicate IPs being throttled before a hard block drops them entirely.
- Pool exhaustion risk. How many clean IPs remain in active rotation versus how many are cooling off? If that ratio gets uncomfortable, you're heading toward a capacity problem.
Rotation Strategy
- Rotate on session boundaries, not just on ban detection. By the time you detect a ban, the IP is already flagged. Rotating earlier keeps the pool cleaner.
- Match proxy type to target tier. Datacenter proxies for unprotected sites. Residential proxies for protected ones. Mobile proxies for the most aggressive detection environments. Using datacenter IPs against a site running behavioral analysis is a fast way to burn your pool.
- Geographic targeting matters. Route requests from IPs that match the expected user geography for that site. A US retailer's bot detection will behave differently toward traffic that looks like it's coming from a datacenter in Eastern Europe.
Rate Limiting as a Discipline
Irregular inter-request timing (not perfectly random, not perfectly even, genuinely inconsistent) mimics human behavior more convincingly than either extreme. Set velocity limits per domain, not globally. A major platform that handles millions of requests daily tolerates very different traffic patterns than a small niche publication.
The architectural note bears repeating: keep proxy management separate from scraping logic. A problem in the proxy pool shouldn't require a scraper redeploy to fix. Separation means you can diagnose, adjust, and scale each component without touching the other.
When Managed Scraping Infrastructure Is the Operationally Correct Choice
At some point the math changes. Running scraping infrastructure in-house isn't always wrong. But it's rarely as cheap as it looks on the surface.
A three-person engineering team running an in-house scraping operation can realistically cost hundreds of thousands of dollars annually when you factor in salaries, infrastructure, and maintenance overhead. That's before you account for the four to eight hours per month per simple target, or the 20-plus hours per month for heavily protected ones. Multiply those hours across a real fleet of targets and you're not running a scraping tool anymore. You're running a scraping department.
The honest question is: what is the actual cost of maintaining this versus delegating it?
Managed scraping platforms handle proxy rotation, fingerprint management, anti-bot adaptation, and infrastructure scaling on your behalf. The market has matured enough that there are real options worth evaluating, including Zyte (formerly Scrapinghub), which offers both managed extraction and a proxy network built specifically for scraping workloads. Bright Data offers enterprise-grade proxy infrastructure with a broad network and compliance-focused data products. ScraperAPI handles JavaScript rendering and anti-bot management as a managed layer your code talks to directly.
Each of these makes a different trade. Zyte leans into full-stack scraping management. Bright Data leans into proxy infrastructure depth and network scale. ScraperAPI leans into simplicity of integration. None of them are a universal answer. All of them are worth comparing against what your in-house operation actually costs per month, fully loaded.
The operationally correct choice depends on your target mix, your team size, and what your developers' time is actually worth. If you're running a handful of low-protection targets with stable structure, in-house is probably fine. If you're maintaining a fleet of targets across varied protection tiers, with freshness requirements and downstream data consumers who notice when quality slips — that's when the managed option starts to look less like a shortcut and more like the obviously correct engineering decision.
The scraper that's cheapest to build is rarely the cheapest to maintain. That gap is where most teams eventually learn this lesson.